Will the ‘September Effect’ impact Bitcoin price this year? 
![]() Cryptocurrency Aug 31, 2024 Share
Cryptocurrency Aug 31, 2024 Share
The “September Effect” is an awaited phenomenon in the stock market, with the month having historically negative returns for investors. Bitcoin (BTC) has seen a similar effect, with September being the worst month for returns, usually punishing cryptocurrency bulls.
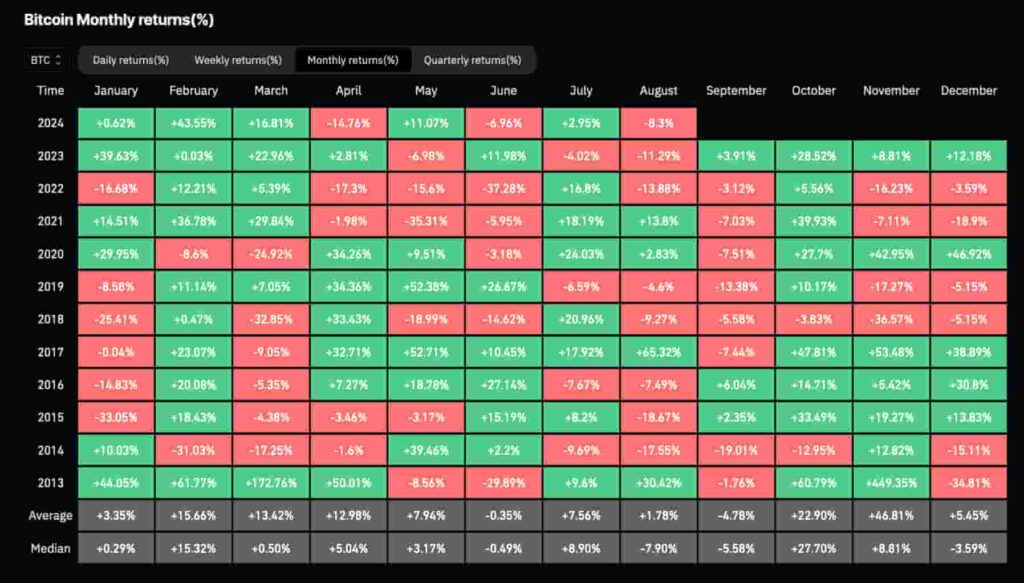
Finbold retrieved data from CoinGlass on August 31, seeking to understand this scenario and provide data-guided insights into cryptocurrencies.
Notably, in September, Bitcoin’s historical average and median monthly returns were -4.78% and -5.58%, respectively. September and June are the only two months with negative average results, with the latter being a neutral -0.35%.
Picks for you
Long bear market alert if Bitcoin stays under this key price level 6 hours ago Is the Gold standard coming back? 6 hours ago 2 cryptocurrencies to reach a $5 billion market cap in September 8 hours ago Ripple to unlock 1 billion XRP tomorrow (September 1); What's next? 10 hours ago
As for the median, August and December join the first two months with -7.90% and -3.59% monthly results. Overall, Bitcoin has positive historical averages and medians in most months, increasing the concerns regarding the potential upcoming “September Effect.”
 Bitcoin Monthly returns (%). Source: CoinGlass
Bitcoin and the September Effect
In eleven months of data, since 2013, Bitcoin has had only three green monthly returns in September. BTC closed the month in 2015 with 2.35% gains and a 6.04% price surge in 2016. Interestingly, last year was the third “green September” for the leading cryptocurrency, up 3.91%.
The worst “Septembers” for Bitcoin were in 2014 and 2019, with two-digit losses of over 19% and 13%, respectively.
In summary, the “September Effect” appears to be a real phenomenon for Bitcoin, which could result in losses for investors.
Nevertheless, there were years with a positive performance in this seemingly cursed month. Therefore, the market could surprise bearish traders who are betting on historical patterns.
Bitcoin (BTC) price analysis
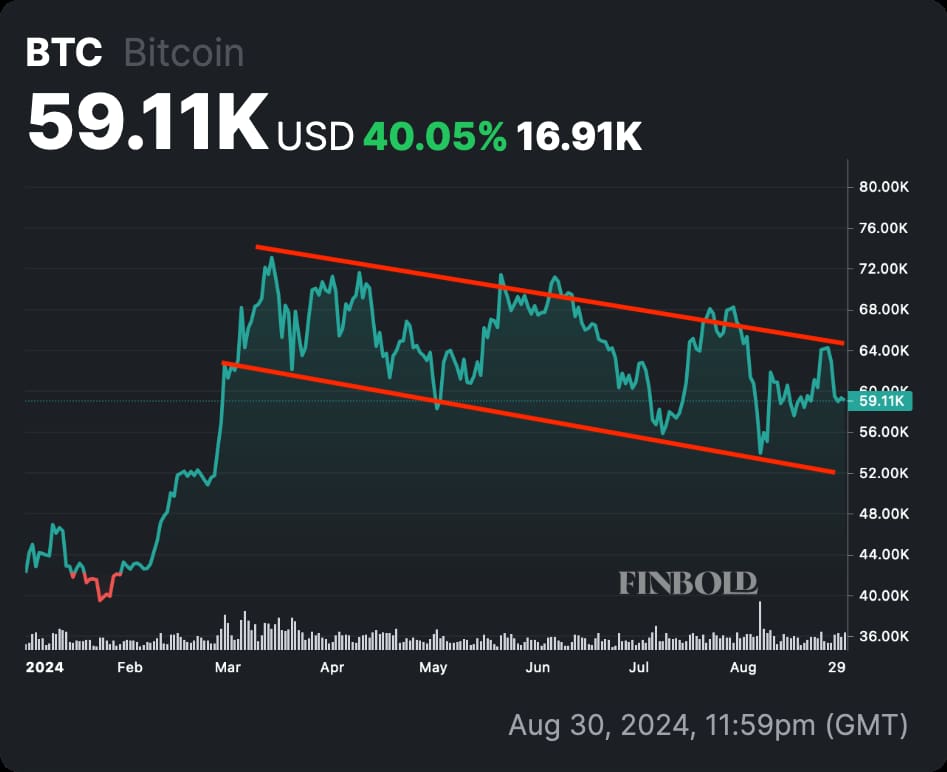
As of this writing, BTC trades at $59,110, up 40.05% year-to-date but with a notable six-month downtrend. Bitcoin price has made lower highs and lower lows since the all-time high in March, evidencing its weak momentum.
 Bitcoin (BTC) year-to-date price chart. Source: Finbold
The on-chain analyst Ali Martinez has warned of a key level at $66,000 that Bitcoin needs to break soon. According to Martinez, trading below this level in the following weeks could signal a long bear market is coming.
Other analysts also share a bearish bias for the short-term while remaining bullish for the mid and long-term. Namely, Ben Walther believes Bitcoin’s chart pattern indicates “more down,” while Alan Santana expects BTC’s “biggest crash” before bouncing up.
All things considered, it is hard to predict whether Bitcoin will go through another “September Effect” this year, accumulating losses. Investors should build their positions with caution and follow their strategies accordingly while closely watching the market.
Disclaimer: The content on this site should not be considered investment advice. Investing is speculative. When investing, your capital is at risk.

