Why Bitcoin is set to surge past $130,000 in January 2025 
![]() Cryptocurrency Oct 20, 2024 Share
Cryptocurrency Oct 20, 2024 Share
A cryptocurrency trading analyst has projected that January 2025 might be the moment when Bitcoin (BTC) clinches a new historical high. This projection follows Bitcoin’s ongoing rally that has placed the asset on the cusp of reclaiming the crucial $70,000 resistance.
Alan Santana, rather than settling for conservative targets of $130,000, suggested that Bitcoin could reach the $155,000 to $200,000 range by early 2025, according to an analysis shared in a TradingView post on October 19.
The expert envisioned two possible trajectories for Bitcoin’s future. In one scenario, Bitcoin could experience an early blow-off top, with a rapid bullish surge peaking around April or May 2025. However, this is considered less likely due to the speed such a rally would require.
Picks for you
What's next for BTC amid European Central Bank's 'declaration of war' on Bitcoin 2 hours ago What Warren Buffett's Bank of America selling spree is telling us 3 hours ago AI bot becomes millionaire as cryptocurrencies skyrocket 18 hours ago Can the meme coin craze ignite a Solana price rally? 20 hours ago
The more probable outcome suggests Bitcoin will break out of its current consolidation and enter a lengthy accumulation phase before rising parabolically. This final surge could drive prices to $155,000 or even as high as $208,000, particularly if inflation worsens or significant geopolitical events occur.
“Not $130,000 but actually much higher, think more of a price number around $155,000 or even $180,000 – $200,000 if inflation gets out of control, the only part that needs adjustment is the date,” the expert noted.
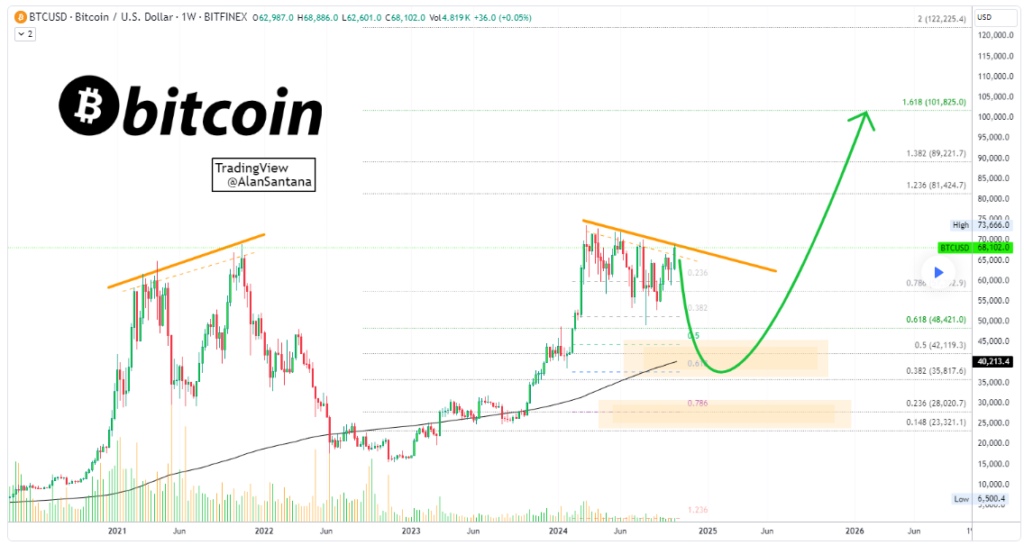 Bitcoin price analysis chart. Source: TradingView
Santana emphasized that Bitcoin will likely experience a “blow-off top” in late 2025, contrasting with the 2021 double-top formation. This blow-off top is typical of Bitcoin’s historical cycles, reminiscent of the 2017 bull market.
A key component of this forecast is Bitcoin’s technical outlook, which outlines notable phases of consolidation followed by a massive rally. The expert highlighted a pattern pointing toward Bitcoin testing support around the 200-day moving average (MA 200), which may create a short-term correction. This correction could bring Bitcoin to around $42,000 before a major bull run starts.
Additionally, the Fibonacci retracement levels align with crucial support and resistance points. The 0.618 Fibonacci and 0.786 levels could act as strong support zones.
Bitcoin’s path to next record high
Indeed, attaining such price targets requires Bitcoin to clinch the crucial $70,000 resistance. To this end, historical data shows that this target might be achievable in the near term.
In particular, analysis by Cycles Fan shows that the maiden cryptocurrency has consistently reached its monthly high toward the end of the month, specifically between the 25th and 29th.
This trend has been observed for the past three months, suggesting that Bitcoin might hit its October high again during this period. If this scenario plays out, Bitcoin might be trading at this level in the coming days.
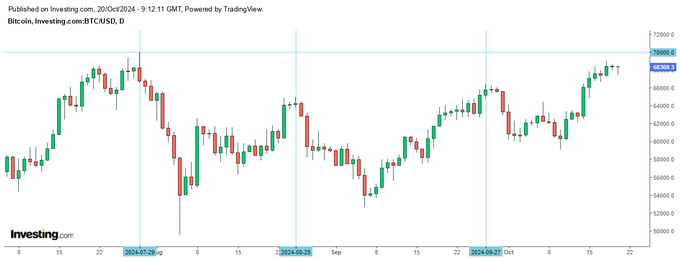 Bitcoin price analysis chart. Source: Investing.com
Meanwhile, an artificial intelligence (AI) tool’s analysis, as per a Finbold report, backs the outlook of trading above $70,000 by the end of October.
As the asset trades above the $65,000 support zone, some in the market maintain that the next bull run is already here. The focus remains on the conservative next record high of $100,000.
Although analysts are expressing bullishness, several sentiments point to caution regarding Bitcoin’s price outlook. For instance, interest in the asset is subdued, considering that Google searches for ‘Bitcoin’ have hit a yearly low. At the same time, the asset could face a regulatory hurdle, with the European Central Bank declaring ‘war’ on Bitcoin.
Bitcoin price analysis
At press time, Bitcoin was trading at $68,372 with daily gains of 0.20%, while on the weekly chart, BTC has rallied over 9%.
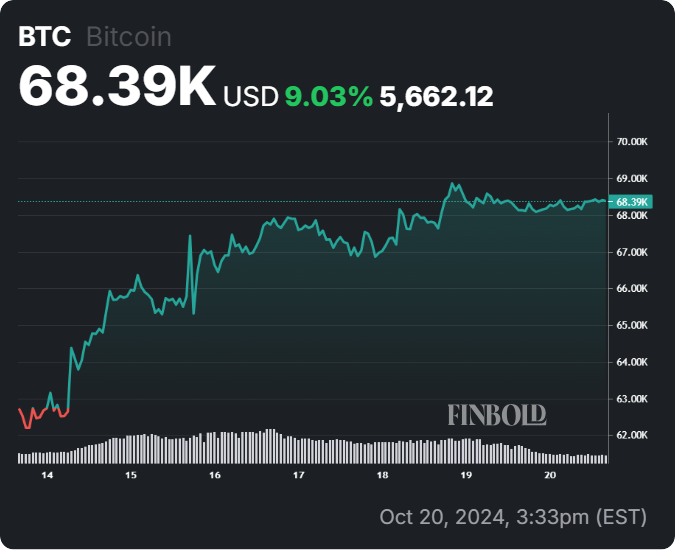 Bitcoin seven-day price chart. Source: Finbold
As things stand, Bitcoin continues to show strength both in the short and long term, comfortably trading above its 50-day and 200-day simple moving averages. However, caution is needed, considering that the asset’s 14-day relative strength index is nearing the overbought territory, standing at 68.04 as of press time.

