This pattern identifies XRP’s path to $8 
![]() Cryptocurrency Jun 7, 2025 Share
Cryptocurrency Jun 7, 2025 Share
Despite XRP facing short-term bearish pressure, the asset may be gearing up for a rally to $8, echoing the historic momentum of 2017.
According to an analysis by Investing Scope, the recent downturn that saw XRP nearly crash below $2 reflects weakening momentum with the token struggling to break out of a narrow consolidation range that began after its January peak.
However, in a TradingView post on June 5, the analyst indicated that the broader monthly chart tells a different, potentially bullish, story.
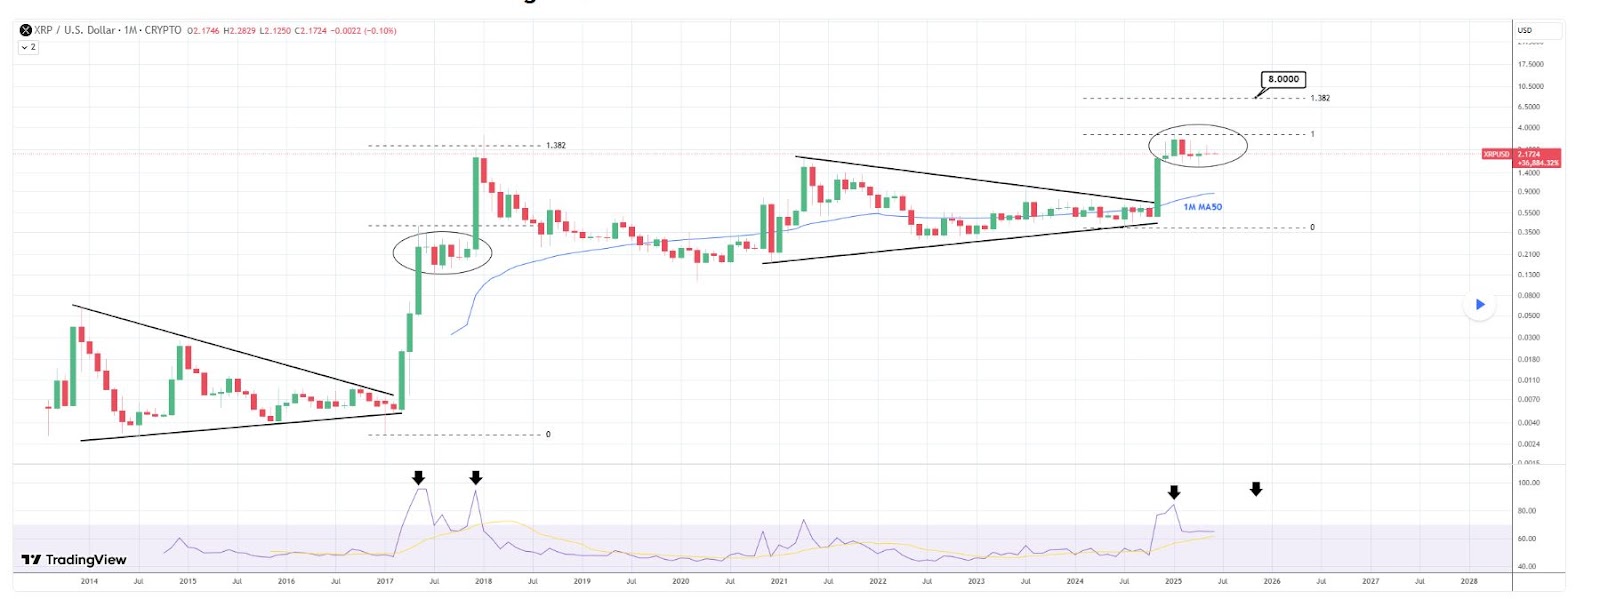 XRP price analysis chart. Source: TradingView
In this case, a recent symmetrical triangle breakout mirrors the pattern observed between 2014 and 2017. At that time, XRP moved sideways before breaking out in late 2017, forming a consolidation range and surging to an all-time high in January 2018, just beyond the 1.382 Fibonacci extension level.
XRP’s $8 target
Currently, the chart shows a similar post-breakout consolidation just below the 1.0 Fibonacci level. Based on historical fractals and Fibonacci extensions, this structure suggests a potential price target of $8, aligning with the 1.382 Fib level from the recent move.
Further strengthening the bullish outlook, the monthly relative strength index (RSI) shows a recurring pattern of peaks, consistent with prior bullish cycles.
Moreover, XRP has decisively moved above the 50-month moving average (MA), historically marking a shift from resistance to support during previous rallies.
This optimistic technical setup is notable as key on-chain activities have sparked speculation. For instance, on June 6, Ripple transferred $498 million worth of XRP to an unknown wallet.
This move deviates from the typical early-month escrow transactions and has stirred market curiosity about XRP’s next direction.
Bit late in the month for escrow moves?
— Tobias James Reily 🐂 (Orbitalnewt) (@TobyJReily) June 6, 2025
XRP price analysis
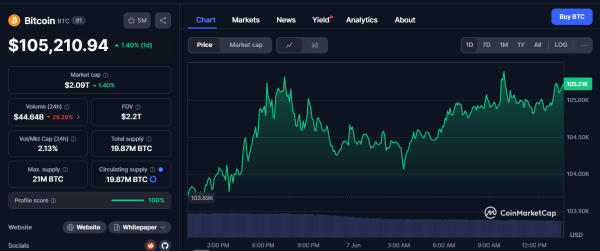
As of press time, XRP was trading at $2.18, up 0.1% over the past 24 hours, but down 0.6% on the week.
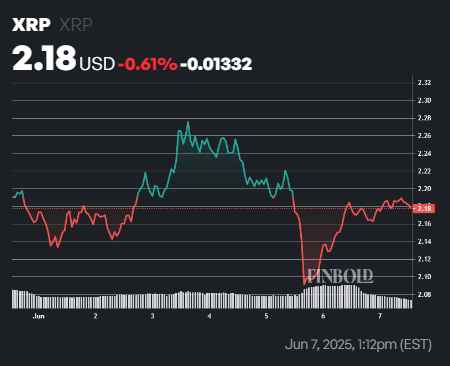 XRP price analysis. Source: Finbold
It remains below its 50-day SMA of $2.29, reflecting short-term bearish sentiment. However, it’s still comfortably above the 200-day SMA at $1.91, indicating a long-term uptrend.
Meanwhile, the 14-day RSI sits at 45.25, indicating slightly bearish yet neutral conditions, with no strong overbought or oversold signals.
Featured image via Shutterstock