Solana’s bullish historical pattern sets SOL for huge breakout 
![]() Cryptocurrency Jul 9, 2024 Share
Cryptocurrency Jul 9, 2024 Share
Solana (SOL) has faced broader market turbulence over the past week but has swiftly rebounded to $140, suggesting further upside ahead.
According to crypto analyst Ali Martinez, in an X post on July 8, Solana’s current price action is mirroring the trajectory observed in 2021. Martinez noted that the SOL Relative Strength Index (RSI) is currently at the same level it was prior to the bullish breakout in 2021, indicating that a major upward SOL price rally could be imminent.
#Solana seems to be mirroring the same price pattern we saw in 2021! Even the $SOL RSI is at the same level it was back then before the big bullish breakout. pic.twitter.com/5QQKjUlZcx
— Ali (@ali_charts) July 8, 2024
Historical comparison and RSI analysis
A thorough analysis of Solana’s chart reveals significant similarities between the current price action and that of mid-2021. During both periods, SOL exhibited a pattern of consolidation followed by an upward breakout.
Picks for you
Buy signal for 2 oversold cryptocurrencies this week 3 hours ago Investors pour $440M into cryptocurrencies despite recent crash 5 hours ago Top economist predicts S&P 500 to hit this high before worst crash since 1929 6 hours ago Sovereign Nature Initiative brings DOTphin to Polkadot 8 hours ago
In July 2021, Solana’s RSI dropped to approximately 40.13 before a substantial price surge. Strikingly, the current RSI level has again dipped to around 40.13, signaling potential bullish momentum for Solana.
Currently, Solana has shown a robust recovery from its recent low of around $127.86, climbing to its present level of $141. This upward movement aligns with the bullish trend observed in mid-2021 when Solana surged from approximately $20 to nearly $260 in a few months.
The RSI level, which is a crucial momentum indicator, has now dipped to around 40.13, a level that historically has been a precursor to significant price rallies for SOL.
Shifts in investment and ETF prospects
In the broader crypto landscape, Solana has overtaken Ethereum (ETH) in attracting significant investment amid a $441 million inflow into the crypto market.
Solana pulled in over $16 million compared to Ethereum’s $10 million, highlighting notable changes in the dynamics of digital asset investments according to a report by Coinshares. One potential reason for this shift is the ongoing discussions about potential Solana exchange-traded funds (ETFs) in the U.S.
Following a similar trajectory to that of spot Ethereum ETFs, Cboe has submitted the 19b-4 filings for the spot Solana ETF on behalf of 21Shares and VanEck. These are the first proposed Solana ETF products seeking approval in the market.
Solana price analysis
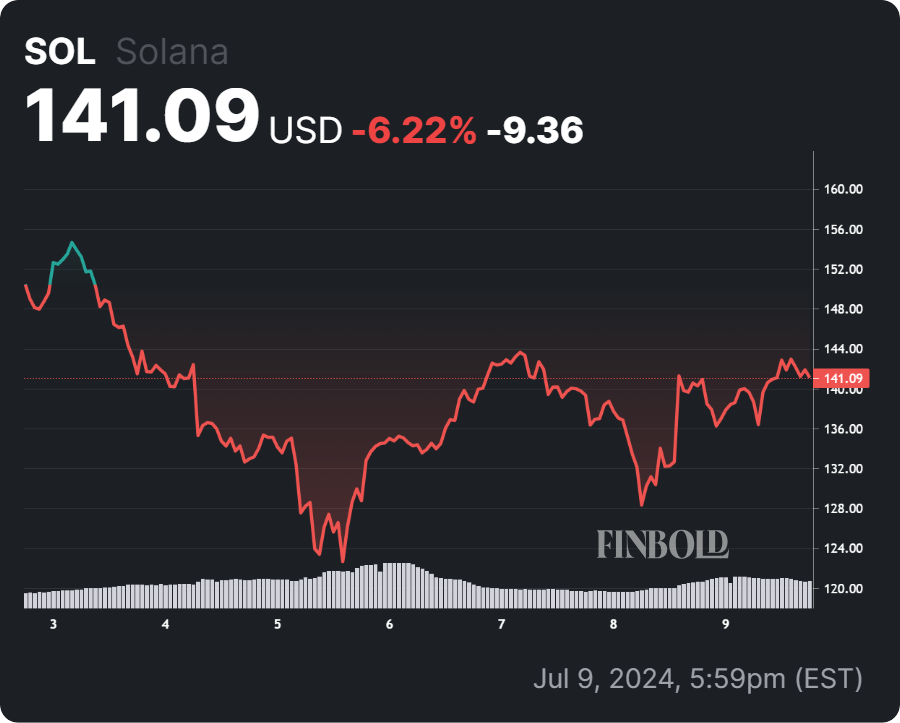
At press time, Solana is trading at $141.99 and is currently experiencing a strong bullish trend in the cryptocurrency market. Given the historical pattern and current technical indicators, SOL could experience a significant rally, mirroring its past performance.
 Solana 7-day price chart. Source: Finbold
Should this trend continue, the price could potentially rise above $200, presenting a lucrative opportunity for investors and traders. The $140 level currently serves as a critical support level, and breaking above this resistance could further confirm the bullish trend, leading to higher price targets.
Disclaimer: The content on this site should not be considered investment advice. Investing is speculative. When investing, your capital is at risk.

