New signal indicates Bitcoin’s bearish trend persisting: Is $48K the next target? 
![]() Cryptocurrency Jul 12, 2024 Share
Cryptocurrency Jul 12, 2024 Share
The anticipation of a possible Bitcoin (BTC) rebound appears to be waning, as indicators point towards potential further declines in the coming days.
Several factors are contributing to this bearish outlook, including the German government’s ongoing sale of seized BTC and the repayments from the defunct Mt. Gox crypto exchange.
This combination of events, along with Bitcoin breaking through multiple key support levels, has increased investor caution.
Picks for you
Pixelverse Secures an additional $2 million from Web3 VCs 40 mins ago Recession alert: Number of distressed companies hits 2008 levels in U.K. 2 hours ago Here’s when XRP could reach $250, according to analyst 3 hours ago We asked ChatGPT-4o what will happen to MicroStrategy stock after the 10-for-1 split; Here’s what it said 4 hours ago
In this context, trading expert Justin Bennett recently highlighted on X (formerly Twitter) that Bitcoin’s bearish trend might persist, with a potential target of $48,000
Factors contributing to the bearish sentiment
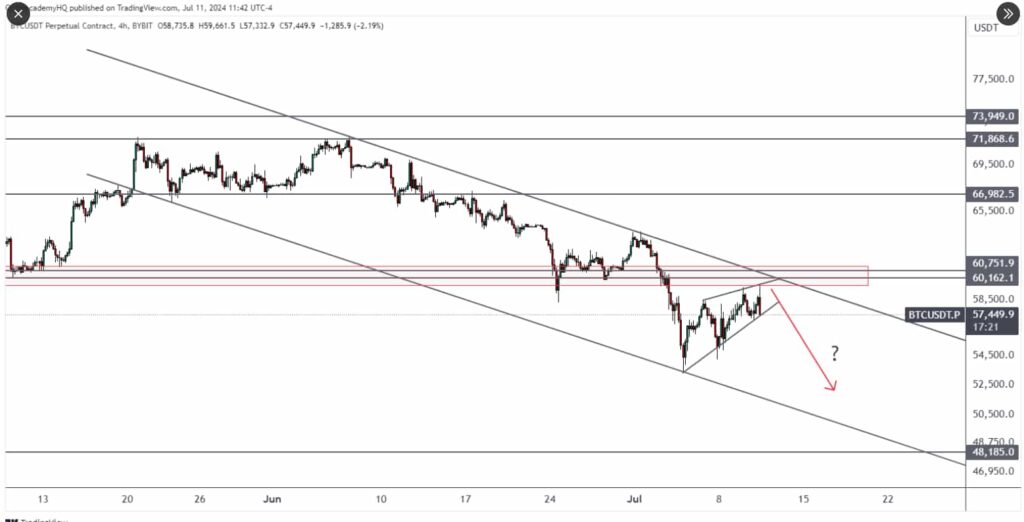
The BTC/USDT chart shows Bitcoin trading within a descending channel, indicating a sustained bearish trend.
Key resistance levels are identified at $66,982, $71,868, and $73,949, while key support levels are noted at $60,162, $57,449, and $48,185. As of the latest data point, Bitcoin is priced at $57,450.
 Bitcoin price analysis chart. Source: Justin Bennett / X
Bitcoin’s price has been consolidating within this descending channel, with a potential rising wedge pattern suggesting further downside risk. The current price is approaching the upper boundary of the descending channel and the horizontal resistance level between $60,752 and $60,162.
A breakout above this resistance zone could signal a bullish reversal, targeting $66,982.5 and $71,868.6.
Conversely, a failure to break the resistance and a subsequent drop below the rising wedge pattern could lead to further declines, with initial support targets at $54,500, followed by $50,500 and $48,185.
Market sentiment and trading strategies
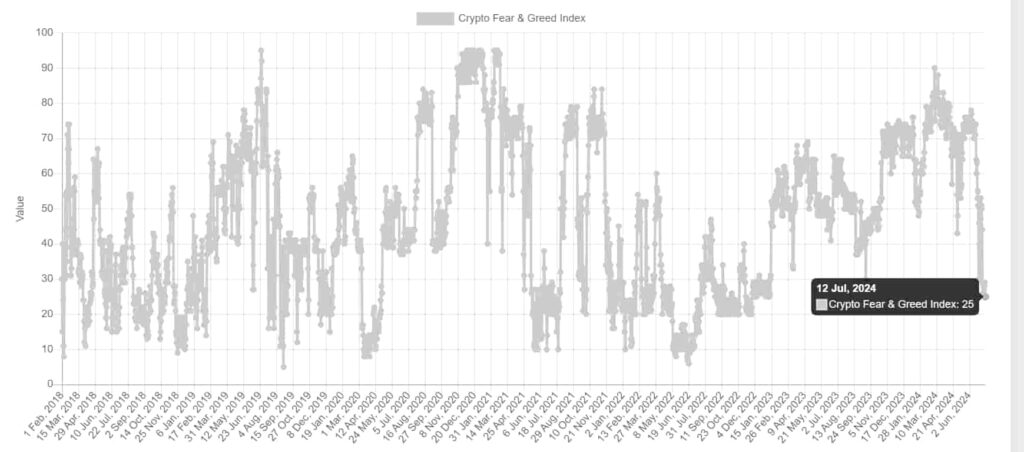
Adding to the bearish sentiment, the Crypto Fear & Greed Index — an indicator that tracks market sentiment toward Bitcoin and crypto — has fallen to “extreme fear,” its lowest level since January 2023.
 Bitcoin Fear & Greed Index. Source: Alternative.me
Bitcoin’s index score has been on a consistent downtrend since it reached a score of 90, indicating “extreme greed,” on March 5, when Bitcoin surpassed its previous all-time high price of $69,000 set back in November 2021.
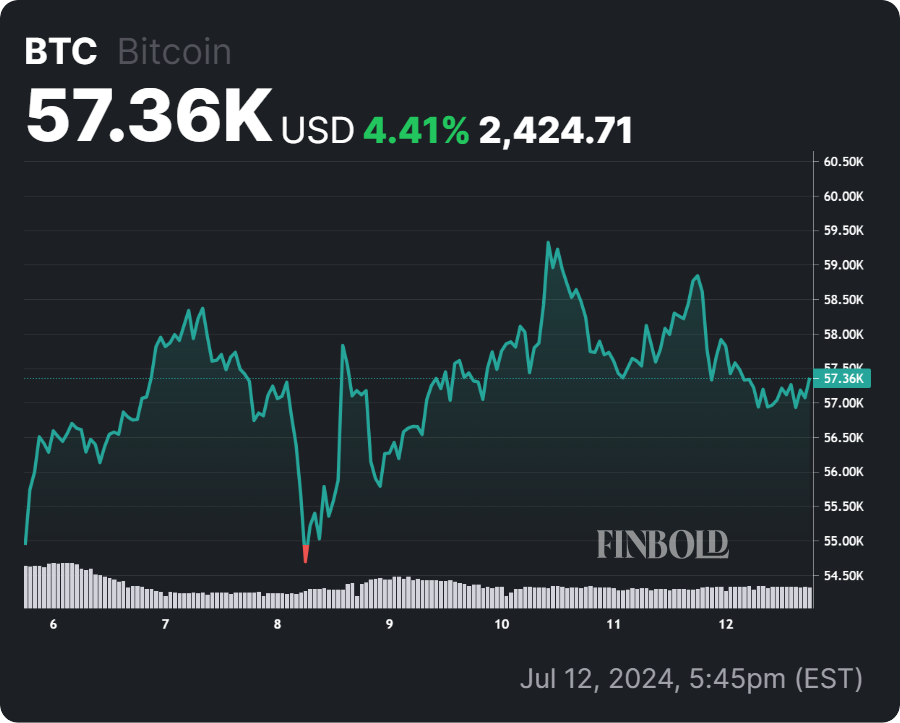
The recent decline in Bitcoin can be partly attributed to the above economic and geopolitical events. This drop was further exacerbated by Bitcoin’s struggle to climb past the $60,000 threshold twice in the last two days.
 Bitcoin 7-day price chart. Source: Finbold
At press time, Bitcoin is trading at $57,448, with a daily decline of about 3%.
For traders and investors, long positions could be considered on a confirmed breakout above $60,752, with targets at $66,982.5 and $71,868.6.
Conversely, short positions could be considered on a confirmed breakdown below the rising wedge pattern with targets at $54,500 and $48,185.
As always, the cryptocurrency market is highly volatile and subject to rapid changes. It is crucial to conduct your own research and use appropriate risk management strategies to make informed decisions.
Disclaimer: The content on this site should not be considered investment advice. Investing is speculative. When investing, your capital is at risk.

