Major XRP price move ‘just around the corner,’ says expert 
![]() Cryptocurrency Apr 21, 2025 Share
Cryptocurrency Apr 21, 2025 Share
An XRP price breakout might be imminent, according to signals from the cryptocurrency’s technical setup.
The key indicator comes from the Bollinger Bands (BB), a technical analysis tool that measures market volatility and potential price movement.
On the latest four-hour chart, XRP’s Bollinger Bands are tightening, meaning the upper and lower bands are converging, as per insights shared by prominent crypto analyst Ali Martinez in an X post on April 21.
“The Bollinger Bands are squeezing on the XRP 4-hour chart, signaling that a major price move could be just around the corner,” Martinez said.
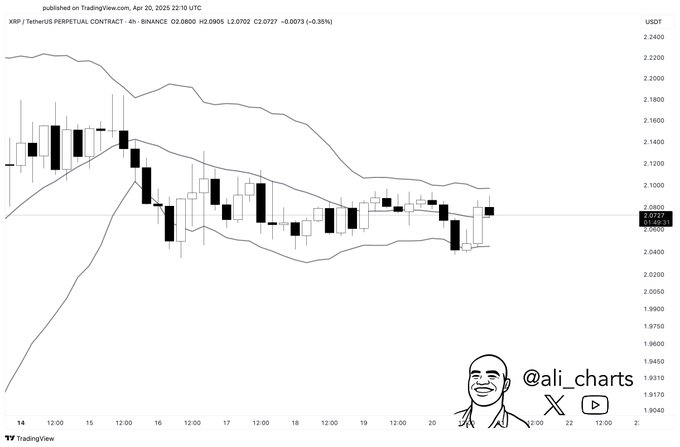 XRP price analysis chart. Source: TradingView/Ali_charts
The “Bollinger Band squeeze” indicates a period of low volatility that often precedes a significant price move, though it doesn’t specify direction. Traders typically await confirmation, while experienced investors prepare for either a breakout or breakdown.
The XRP community would welcome a potential price breakout, given the asset’s recent range-bound price action, consolidating between $2.04 and $2.10 over the last few days.
XRP price indecision
While the native token of the XRP Ledger (XRPL) could potentially target the upside, especially if the broader market rallies, several on-chain indicators have pointed to the possibility of further weakening while offering a mixed picture.
As reported by Finbold, XRP network activity has declined sharply, with new wallet addresses dropping 44%, from 5,200 on March 22 to 2,900 by April 17, highlighting waning investor interest. This trend reinforces the bearish outlook amid continued price consolidation.
Similarly, in April, whales have offloaded over 370 million XRP, but recent activity suggests renewed accumulation, likely driven by speculation around a potential spot exchange-traded fund (ETF) approval and the nearing conclusion of the Ripple v. SEC case.
Given the digital assets’s muted reaction to these developments, the broader market movement now appears to be the primary catalyst likely to dictate how the asset moves.
XRP price analysis
At the time of reporting, XRP was trading at $2.13, gaining over 3% on the day. Over the past seven days, the token has posted modest gains of less than 0.1%.
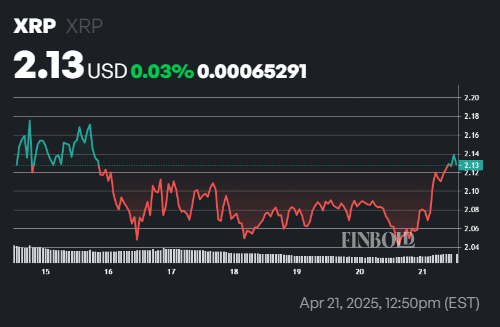 XRP seven-day price chart. Source: Finbold
Although XRP has made a minor upward push aligned with broader market trends, the asset remains in a consolidation phase. The overall sentiment leans toward caution, with investors showing indecision, as reflected by a Relative Strength Index (RSI) reading of 48.
At the current price, XRP is trading below the 50-day simple moving average (SMA) of $2.25 but above the 200-day SMA of $1.90, signaling short-term weakness but a still-intact long-term uptrend.
Featured image via Shutterstock