A recent X post highlights an important observation in Bitcoin’s mining landscape, mainly the Hash Ribbon indicator that shows an 8% increase in miner activity since the last difficulty drop.
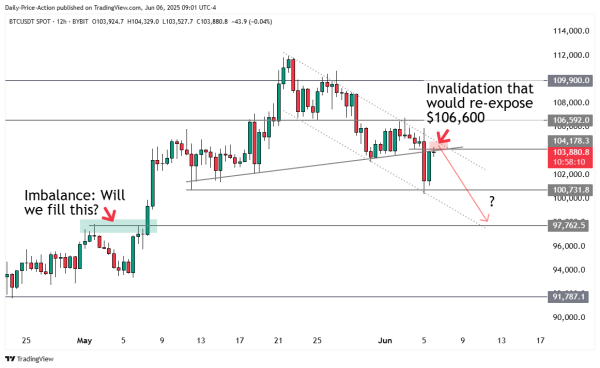
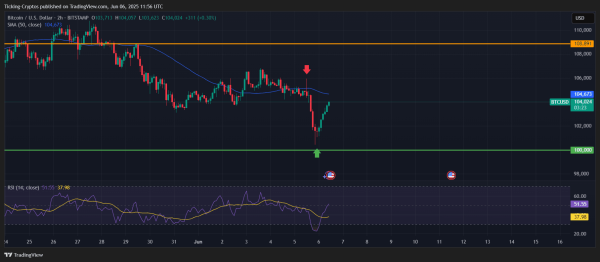
While the chart suggests a recovery from miner capitulation, it hasn’t yet reached the >15% threshold typically associated with a strong bullish trend confirmation for Bitcoin (BTC). The Hash Ribbon chart shows historical patterns where miner capitulation (red bars) often precedes price bottoms, with a recent 5-month recovery period implying Bitcoin’s price may be stabilizing around its current price at approximately $103k.
Is Bitcoin Miner Capitulation Over? Hash Ribbon Indicator Analysis May 2025
This year, there have been several Bitcoin mining-related happenings. For instance, in February, Bitcoin’s mining difficulty reached an all-time high of 114.7 trillion, following a 5.6% upward adjustment. This increase reflects a surge in the network’s hash rate, demonstrating a heightened competition among miners.
Then, a month later, the Hash Ribbon indicator flashed its first buy signal in eight months, suggesting the end of the miner capitulation phase. Generally speaking, such signals have preceded big price rallies in Bitcoin. Interestingly enough, this did occur, with Bitcoin around $80k during that time, and even dropping below $76k at one point. Granted, a lot of factors can be attributed to this, but it’s worth noting nevertheless.
Finally, a few weeks ago in April, it was reported that Bitcoin’s mining difficulty was poised for its steepest downward adjustment since December 2022, with estimates pointing to a decline of around 6%.
Understanding the Bitcoin Hash Ribbon Indicator
The Hash Ribbon is a technical analysis tool that monitors Bitcoin’s mining activity by comparing the 30-day and 60-day moving averages (MAs) of the network’s hash rate.
When the 30-day MA crosses below the 60-day MA, it signals miner capitulation, which is a period where mining becomes unprofitable and leads miners to shut down operations. On the other hand, when the 30-day MA crosses above the 60-day MA, it indicates miner recovery and is often interpreted as a bullish signal for Bitcoin’s price.
The current data hints at the possibility that Bitcoin’s mining ecosystem is in a recovery phase following a period of capitulation. The 8% increase in miner activity is a good sign, but a more notable uptick will likely be needed to confirm a strong bullish trend.
Disclaimer: The information presented in this article is for informational and educational purposes only. The article does not constitute financial advice or advice of any kind. Coin Edition is not responsible for any losses incurred as a result of the utilization of content, products, or services mentioned. Readers are advised to exercise caution before taking any action related to the company.


