Expert sets Bitcoin price for Q3 2025 
![]() Cryptocurrency Jun 7, 2025 Share
Cryptocurrency Jun 7, 2025 Share
Bitcoin (BTC) may be on track to reach a new all-time high in the third quarter of 2025, according to insights comparing its trading patterns to those of gold.
In this case, cryptocurrency analyst Ted Pillows highlighted this parallel, noting similarities between Bitcoin’s current price behavior and gold’s historical rally, he said in an X post on June 7.
In his breakdown, Pillows explained that Bitcoin appears to follow the same sequence of market phases gold experienced before its major breakout.
He noted that gold went through a distribution phase, followed by years of accumulation between 2013 and 2018. It then entered a re-accumulation phase after 2020, leading to a sharp rally to record highs of around $3,500.
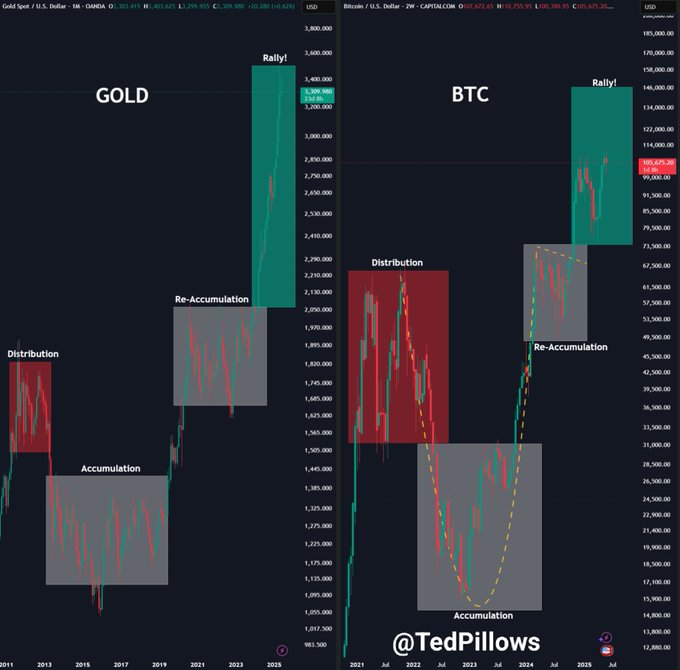 Gold and Bitcoin price analysis chart. Source: Ted Pillows
According to Pillows, Bitcoin is mirroring that path. After peaking in 2021, BTC underwent a steep correction, followed by an accumulation phase throughout 2022 and 2023.
In 2024, Bitcoin entered what Pillows described as a re-accumulation phase, gaining momentum and breaking higher. If the pattern holds, it could enter a rally phase similar to gold’s before its surge.
Pillows noted that both assets corrected after hitting new highs, reinforcing the comparison. To this end, the expert projects that Bitcoin could reach $125,000 to $130,000 by Q3 2025.
“BTC is perfectly mimicking Gold’s rally. Gold also had a correction after hitting the new ATH, and the same happened with BTC. I think BTC will hit $125,000 to $130,000 by Q3 2025,” Pillows said.
While the price patterns align, Bitcoin and gold remain fundamentally different. The precious metal is a centuries-old store of value, while Bitcoin is still evolving. Still, both have shown strong momentum in 2025.
Bitcoin’s key price levels to watch
Meanwhile, a separate analysis by RLinda, published on TradingView on July 7, highlighted key Bitcoin technical levels to monitor. She noted that BTC is recovering after a liquidity sweep of nearly $100,000, though the short-term outlook remains mixed.
While the broader trend is bullish, the market is in a corrective phase with a bearish structure below key resistance.
Bitcoin is currently testing the $105,900 and $106,720 zones. If buying momentum weakens, a rejection here could drop the price to $103,000.
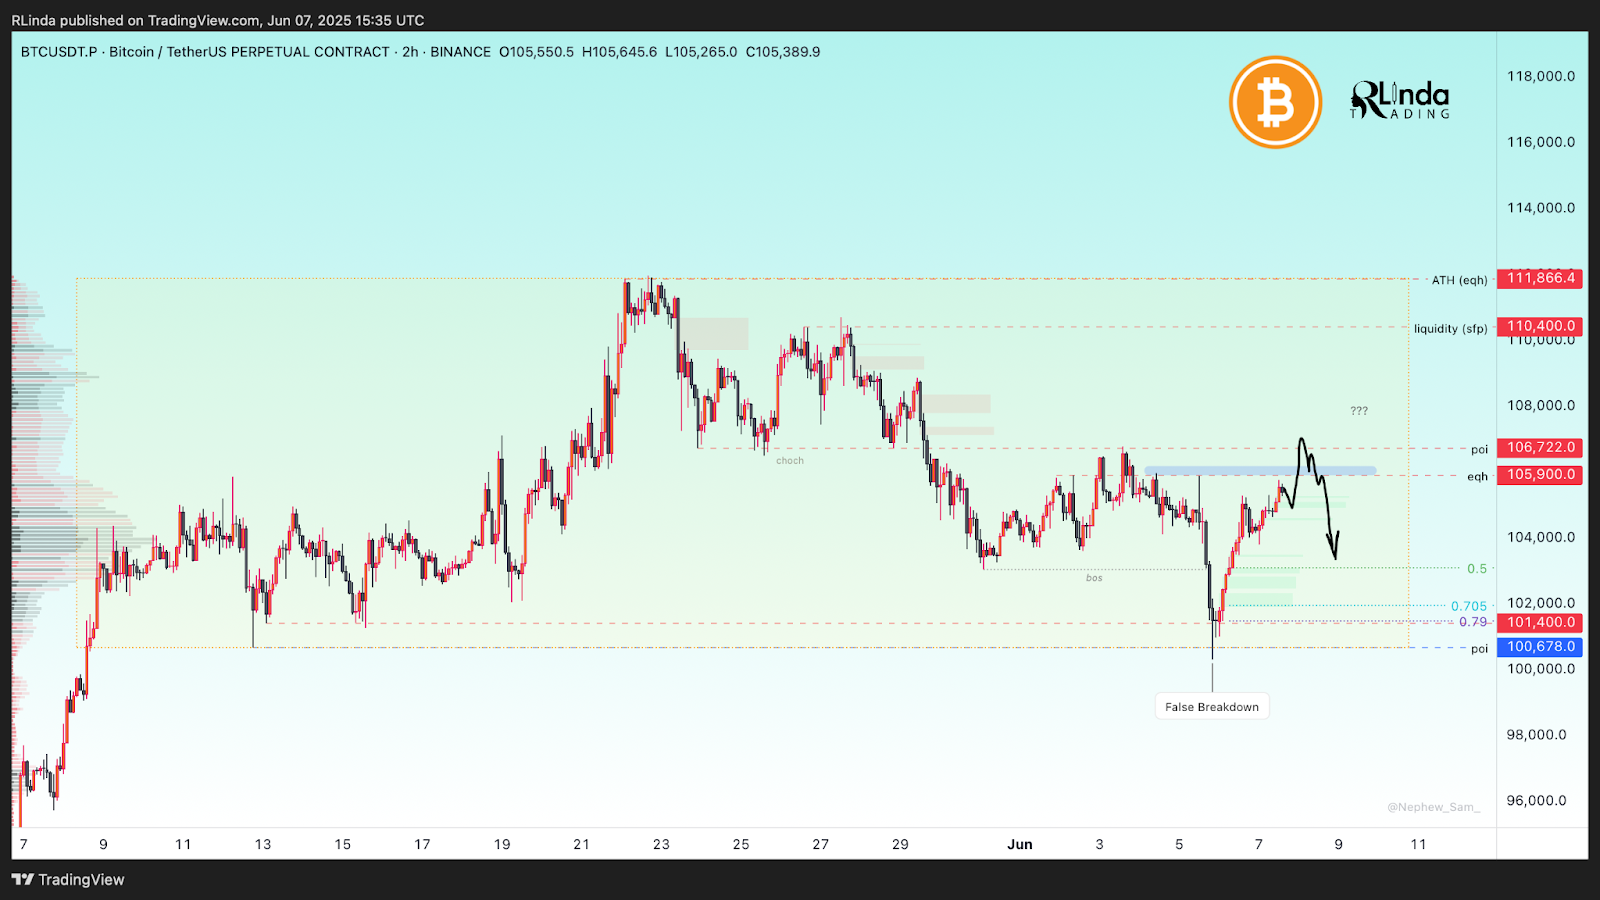 Bitcoin price analysis chart. Source: TradingView
However, RLinda noted that a sustained move above $105,500 could revive bullish momentum and push prices toward $110,400, assuming support holds.
Bitcoin price analysis
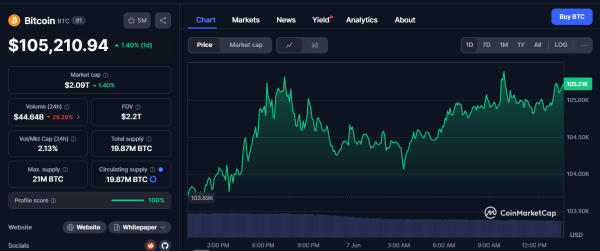
By press time, Bitcoin was trading at $105,660, up 0.5% in the past 24 hours and nearly 1% over the past week.
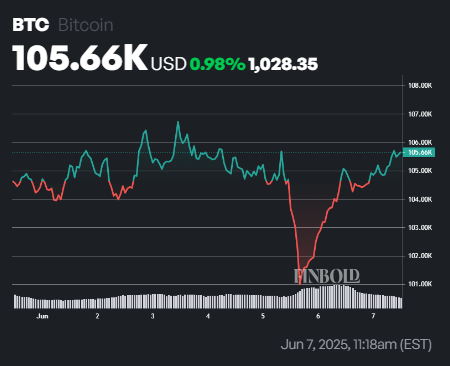 Bitcoin seven-day price chart. Source: Finbold
The current price sits comfortably above its 50-day ($100,893) and 200-day ($87,224) simple moving averages (SMA), indicating continued bullish momentum.
Meanwhile, the 14-day Relative Strength Index (RSI) stands at 51.09, signaling neutral market conditions, with no immediate signs of the asset being overbought or oversold.
Featured image via Shutterstock