- Although Bitcoin has formed a symmetrical triangle pattern this pattern indicates it will soon shift due to approaching resistance and support levels.
- The price movement of BTC expects either a rejection at $90,100 or a decline toward $85,500 from current trading levels.
- A neutral trend among market indicators emerges because RSI shows 53.58 and MACD generates bullish signals but the trading volume validates or breaks down potential breakout strength.
Bitcoin is currently trading within a triangular price pattern, signaling an imminent breakout that could determine its next major move. As the cryptocurrency hovers around the $88,202.78 mark with a 1.2% daily increase, traders are closely watching key resistance and support levels. A breakout in either direction could set the tone for Bitcoin’s short-term trajectory.
$BTC is moving inside a triangle, and a breakout is coming soon.
The direction will set the next big move!
📈 If it goes up: It could reach $90,100
📉 If it drops: It may fall to $85,500
A big move is coming.
H/T @TheMoonCarl for the chart.👍#Bitcoin #BTC #Crypto $GME pic.twitter.com/mdaUaYghin
— Rananjay Singh (@TodayCryptoRj) March 26, 2025
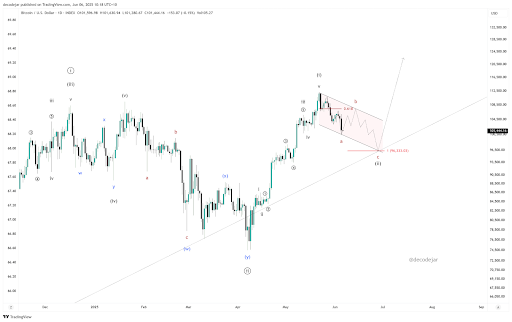
Bitcoin shows recent market data that indicates it is trading within a symmetrical triangle pattern. The price action within the chart occurs between an upward supporting line and downward resistance line.These converging trend lines indicate that price volatility is narrowing, and a decisive breakout is likely in the coming sessions.
The ongoing price movement of Bitcoin within 24- hours demonstrates a restricted range from $87,032.94 to $88,430.06 thus strengthening the evidence of an upcoming breach.
Bitcoin’s Breakout Potential or Deeper Pullback?
Bitcoin has the potential to rise 2.1% to approximately $90,100 if it surpasses the resistance trendline. The successful breakthrough of this price area would activate additional market buying which could drive Bitcoin above $91,000.
A breach of the support line would prompt Bitcoin to move toward $85,500 which represents a 3.1% decrease. A price area located at this level acts as a historical support region where previous buyers have defended against further market downturns.
Bitcoin at a Crossroads: Will Bulls or Bears Take Control?
The current market position of Bitcoin indicates indecisiveness because no single group of buyers or sellers holds complete dominance. A rise above resistance levels would start fresh uptrend action that would draw additional investors to Bitcoin’s price. A crucial breakdown indicates profit-taking responses followed by growing selling forces which generate short-term price declines.
Source:Tradingview
Traders should monitor key volume levels and momentum indicators. The Relative Strength Index (RSI) is currently trading at 53.58 showing that BTC is in neutral position with the MACD line trading above the signal line showing positive momentum.An increase in volume accompanying a breakout would confirm the move, while weak volume could suggest a potential fakeout.
Future Outlook: What Comes Next for Bitcoin?
The Bitcoin market demonstrates strong volatility and changes in macro-economics together with institutional adoption and regulatory decisions are factors that affect price movements. An ongoing bullish cycle for Bitcoin becomes possible after it successfully breaks past resistance through its current upward trend. Short-term price volatility might rise in case Bitcoin fails to sustain its position above essential support areas.
Market participants need to be attentive to price changes since Bitcoin reaches its possible breakout level. The upcoming days hold critical importance for Bitcoin because its price will either push toward $90,100 or return towards $85,500 after possibly being rejected at current levels.