Bitcoin’s parabolic rally: Why $170,000 could be the next target 
![]() Cryptocurrency Nov 5, 2024 Share
Cryptocurrency Nov 5, 2024 Share
With Bitcoin (BTC) holding above the $70,000 mark, market attention remains focused on whether the maiden cryptocurrency can experience a potential breakout in the near future.
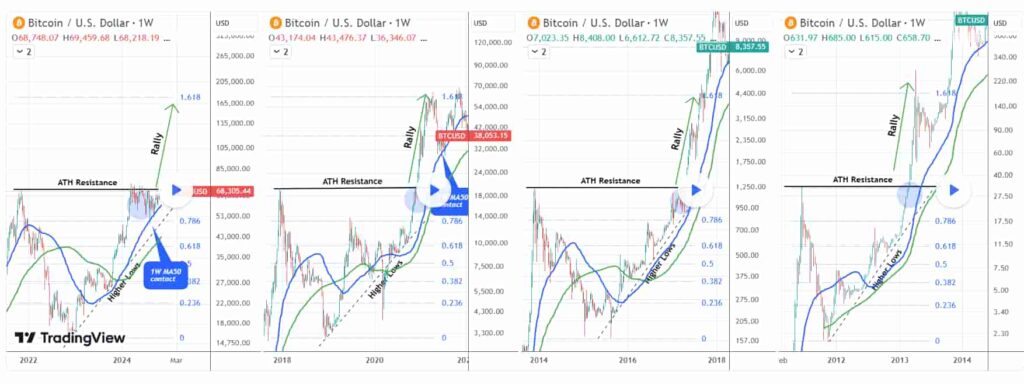
Notably, crypto analyst TradingShot shared insights in a TradingView post on November 4, analyzing Bitcoin’s technical setup and its potential to reach the $170,000 level.
 Bitcoin price analysis chart. Source: TradingShot/TradingView
Historical patterns: Rebounding from key support levels
Historically, Bitcoin has shown a strong tendency to rally after rebounding from significant support levels, the 50-week Moving Average (1W MA-50).
Picks for you
DOGE or SHIB? We asked ChatGPT-4o which is a better buy for 2025 7 hours ago Key gold price levels to watch after U.S. presidential elections 8 hours ago Pnut (PNUT) crypto token soars over 100% ahead of U.S. election 9 hours ago Here’s how the market is pricing the US presidential elections today 10 hours ago
In this current cycle, Bitcoin has successfully held this support twice, triggering a rally that recently tested the $73,800 All-Time High (ATH).
This behavior mirrors previous cycles where a rebound from the 1W MA50 preceded a substantial price increase, providing a bullish outlook for the weeks ahead.
The market is now closely monitoring whether Bitcoin can decisively break above this ATH, signaling a continuation of its bullish trend.
Key levels to watch: Fibonacci and ATH resistance
According to the analysis, the immediate level to watch is $73,800, which serves as a critical resistance point.
A decisive breakout above this level would likely confirm the continuation of the bullish trend.
Beyond that, the 1.618 Fibonacci extension level is the next major target, projected at approximately $170,000. This Fibonacci level, derived from the previous ATH, has historically been a significant target during Bitcoin’s bull runs.
On the downside, holding the $70,000 level remains crucial for maintaining the bullish structure. A breach below this could signal a retest of the 1W MA50, which currently acts as critical support.
Investors should monitor these levels closely, as they will provide key insights into Bitcoin’s next potential move and the strength of its ongoing rally.
Post-election trends and market sentiment
This bullish projection is reinforced by historical trends, particularly the pattern of post-election rallies, which have often seen Bitcoin make significant gains.
Should Bitcoin sustain its current momentum and successfully break through the $73,800, the path toward $170,000 could unfold in the coming months.
Echoing this optimistic outlook, trader Alan Santana predicts that Bitcoin could climb to $130,000, with the potential to reach between $155,000 and $200,000 by early 2025.
Furthermore, some AI models project that Bitcoin could hit $100,000 by mid-2025, adding to the growing consensus of a continued bullish trajectory
Bitcoin price analysis
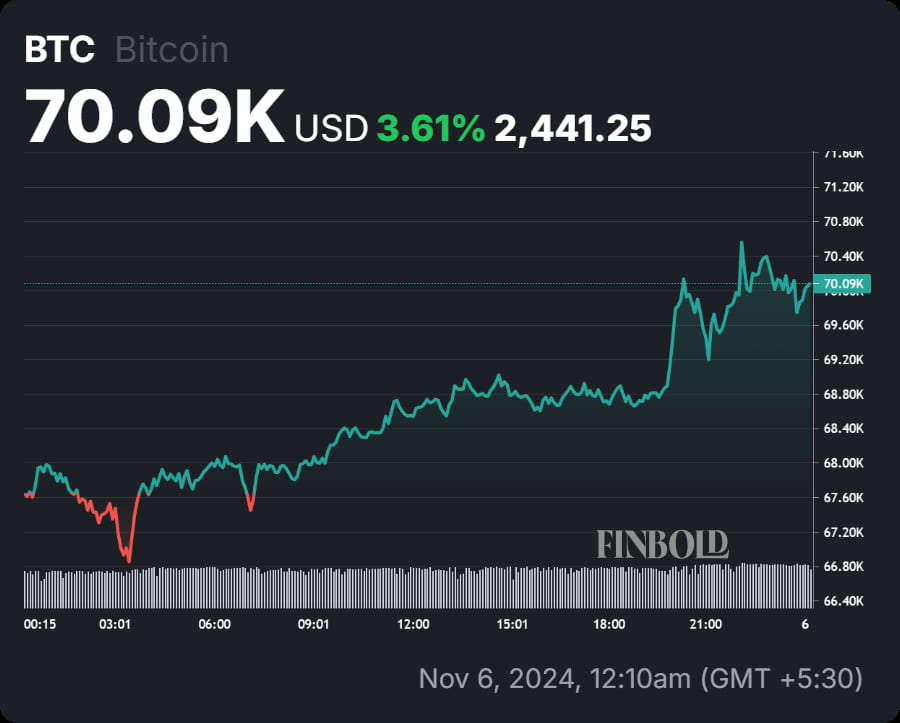
At press time, Bitcoin was trading at $70,220, reflecting a gain of over 3% in the past 24 hours.
 BTC one-day price chart. Source: Finbold
With Bitcoin holding firmly above the $70,000 mark, the technical setup appears increasingly promising.
A decisive break above $73,800 could pave the way for a rally toward $170,000, supported by strong historical patterns and the typical post-election bullish momentum.


