As the liquidation in the crypto market nears $400 million, the downfall in Bitcoin is gaining momentum. Decking under the $85,000 support, Bitcoin has registered a 2.78% intraday pullback, creating a bearish and dating candle.
This undermines the past week’s recovery and warns of an extended correction. Will this result in a retest of the $76,000 mark? Let’s find out.
Bitcoin Price Analysis
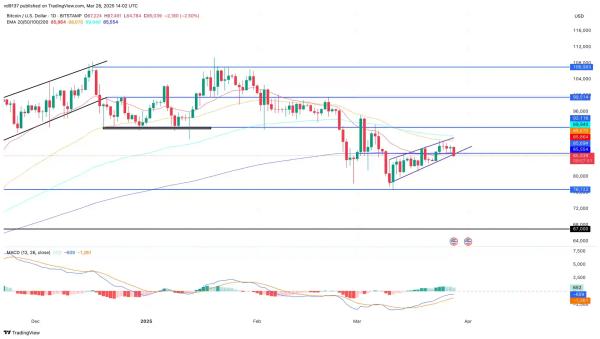
In the daily chart, the BTC price trend signaled a short-term recovery in a rising channel pattern. However, due to the prevailing downtrend, the Bitcoin price action now forms a bearish flag.
 Bitcoin price chart
Furthermore, the intraday pullback, creating a bearish engulfing candle, warns of a breakdown run. Crashing under the 200-day EMI line and the local support trend line, the sudden surge in supply pressure warns of an extended correction.
The declining trend has breezed under the $85,000 mark and is currently trading at a market value of $84,654. With the massive crash in Bitcoin prices, the broader market is witnessing a new wave of sell-off.
Derivatives Market Witnesses A Fear Spike
As the Bitcoin prices fall, the derivatives market takes a hit. The Bitcoin open interest is down by 2.57%, reaching $55.47 billion. Meanwhile, the long-to-short ratio over the past few hours has turned extremely bearish.
The short positions now constitute 59.28%, with an overall long-to-short ratio of 0.6869. This signals a massive surge in the number of selling positions.
Bitcoin Price Targets
Based on the price action analysis and the sudden surge in bearish sentiments in the crypto market, the declining trend is likely to gain momentum. The breakdown rally will likely find the immediate support close to the $80,000 psychological support, followed by the horizontal level at $76,722.
However, if the bulls manage to witness an overpriced rejection, the uptrend will likely scale up to the $92,118 resistance level.