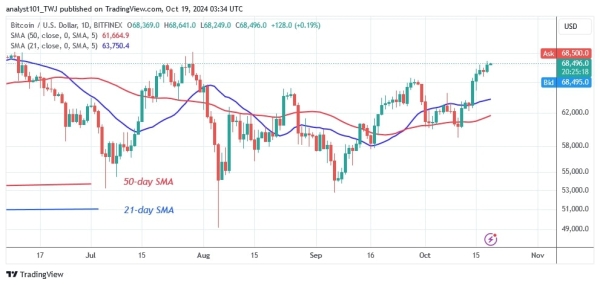
The price of Bitcoin (BTC) has continued its upward trend after breaking out on October 11. The largest cryptocurrency broke above the moving average lines and the $65,000 mark.
Long-term forecast for the BTC price: bullish
Bitcoin price is currently trading at a high of $68,350, according to Coinidol.com. On the upside, Bitcoin is expected to reach the psychological price of $70,000. Nevertheless, the positive trend will continue up to the highs of $72,000 and $73,588, where the psychological price barrier will be broken.
However, if Bitcoin is rejected at its high of $70,000, the bullish hypothesis will be disproved. Bitcoin will fall and slip above the $65,000 breakout level. The negative momentum could be above the 21-day SMA support. Meanwhile, the uptrend has paused near the $69,000 high.
BTC indicator reading
Bitcoin is in an uptrend with the moving average lines sloping down. The price bars are above the moving average lines and above the 21-day SMA, which serves as a support level. If the 21-day support level is broken, the current upswing will end. Bitcoin will trade in the bullish trend zone as long as the price bars remain above the moving average lines.
Technical indicators:
Resistance Levels – $70,000 and $80,000
Support Levels – $50,000 and $40,000

What is the next direction for BTC/USD?
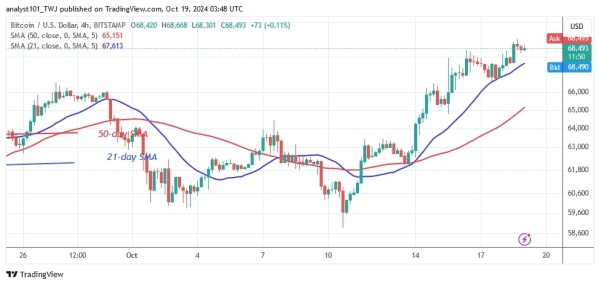
The 4-hour chart shows that Bitcoin is in an uptrend after breaking through the initial barrier at $65,000. Bitcoin has stalled after reaching the $70,000 resistance level. The cryptocurrency is forming indecisive candlesticks with small bodies as it enters the overbought territory. Bitcoin price is moving slightly back towards the moving average lines. If the cryptocurrency finds support, it will resume its uptrend.

Disclaimer. This analysis and forecast are the personal opinions of the author. They are not a recommendation to buy or sell cryptocurrency and should not be viewed as an endorsement by CoinIdol.com. Readers should do their research before investing in funds.

