A crypto analyst who nailed the 2021 Bitcoin market meltdown says that a BTC indicator is suddenly flashing bullish.
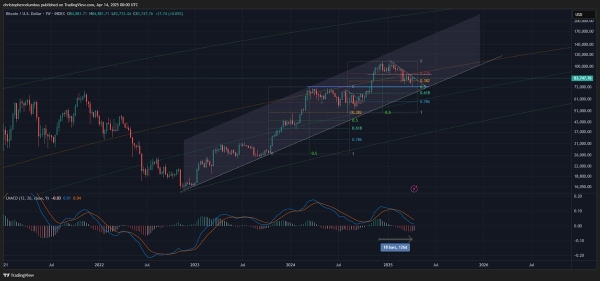
Pseudonymous analyst Dave the Wave tells his 149,300 followers on the social media platform X that Bitcoin’s weekly logarithmic moving average convergence divergence (LMACD) histogram indicator is starting to strengthen, signaling a possible rally.
The LMACD histogram indicator is designed to signal changes in an asset’s trend, strength and momentum. Shrinking bars on the histogram suggest that an asset’s trend momentum is weakening. In Bitcoin’s case, the histogram’s declining red bars may indicate that a market reversal is in sight.
Says Dave the Wave,
“Bull markets climb a wall of worry. First strengthening histogram on the weekly BTC chart in 18 weeks/4.5 months. Weekly MACD itself has not been below the zero-line, in bear territory, since Feb 2023, i.e.; an ongoing bull market. People drop the ball when they ignore the technicals.”
 Source: Dave the Wave/X
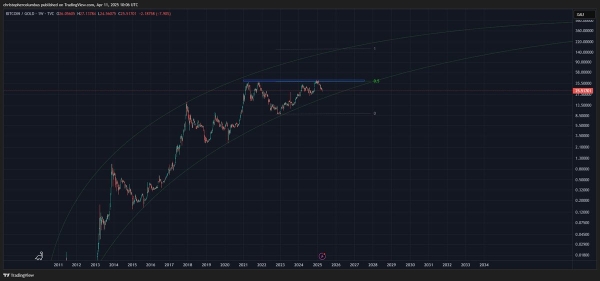
Next up, he looks at the BTC/gold ratio, which is the value of Bitcoin relative to the price of gold. Based on the trader’s chart, he appears to suggest that the BTC/gold ratio may have topped out, indicating that Bitcoin may soon outperform gold.
 Source: Dave the Wave/X
Lastly, Dave the Wave shares a chart that shows BTC has been out of the “buy zone” of his logarithmic growth curve (LGC) since it was last trading around $40,000.
The LGC aims to forecast Bitcoin’s market cycle highs and lows while filtering out short-term volatility.
“Back when BTC was half the price that was the last time it hit the LGC ‘buy zone.’”
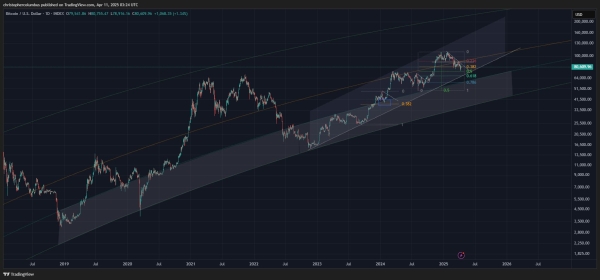 Source: Dave the Wave/X
Bitcoin is trading for $84,459 at time of writing, flat on the day.
Generated Image: Midjourney