Bitcoin has fallen below $105K as bearish divergence and weak derivatives data signal a deeper correction ahead.
As Bitcoin dips below the $105,000 mark, declining bullish momentum warns of a steeper correction beneath a crucial support trendline. Could this potential breakdown push Bitcoin back to the $100,000 level?
Bitcoin Price Analysis
Bitcoin’s four-hour chart showcases a bullish failure to cross above the $112,000 level, creating an all-time high at $111,970. With multiple lower highs, Bitcoin is back at a crucial support trendline as it breaks under the 50 and 100-period EMAs.
Bitcoin price chart
According to Fibonacci levels, the decline breached the 23.60% retracement level at $107,545. Additionally, the sudden pullback is signaling a potential bearish crossover between the 50- and 100-period EMAs.
Currently, Bitcoin trades at $104,639, reflecting a drop of more than 6% from the all-time high. As the price falls, the daily RSI line has turned bearish, moving below the midpoint. This reflects waning bullish momentum and raises the likelihood of a breakdown.
Based on Fibonacci levels, a potential close below the support trendline at $103,534 would increase the chances of a deeper correction. However, several support levels lie nearby, including the 200-period EMA at $103,230 and the 50% Fibonacci level at $102,795, which could potentially absorb selling pressure.
That said, a breakdown below the 50% Fibonacci level could open the door for Bitcoin to retrace toward the $100,000 mark, with the final line of defense at the May low of $101,763.
Conversely, a bounce from the support trendline could lead to a retest of the 23.60% Fibonacci level at $107,545.
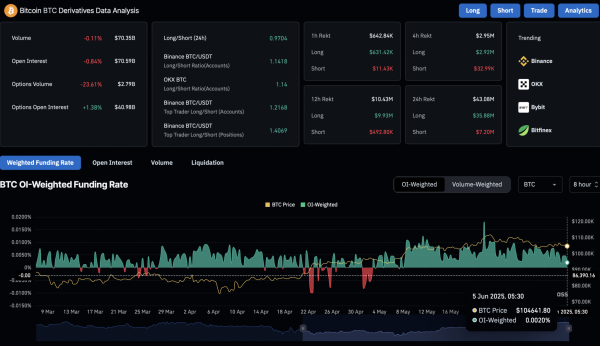
Derivatives Data Suggests Drop in Optimism
With the pullback in the Bitcoin spot price, CoinGlass data shows a 0.84% drop in open interest, now at $70.59 billion. Over the past 24 hours, declining interest among derivative traders has resulted in the liquidation of $35.88 million in long positions, while short liquidations remain limited at $7.20 million.
 ETH Derivatives
Additionally, the funding rate has declined to 0.0020% from a recent high of 0.0047%, signaling a significant reduction in bullish trading activity. As a result, the derivatives market is showing a notable increase in bearish sentiment.