- Bitcoin dropped 3.76% after hitting a high of $64,443 on October 7, currently trading around $62,438.
- The U.S. Supreme Court has declined to hear an appeal over the ownership of 69,370 Bitcoins seized from the Silk Road.
The price of Bitcoin (BTC) fell nearly 2% over the last 24 hours, after reaching a peak of $64,443 on October 7. At the time of writing, Bitcoin is priced at $62,438, 3.76% down from its earlier high. The cryptocurrency briefly dipped to an intraday low of $62,152, even as trading volume climbed by over 72%.
While Bitcoin has started the week with high trends, this recent decline has raised concerns. Also, the drop comes when the Chinese market performance is strong, with stocks surging to two-year highs. The CSI300 index jumped 10% at the start of trading after a week-long holiday, while the Shanghai Composite rose by 9.7%, reaching its highest levels since December 2021. However, Bitcoin saw a decline of approx. 1.61% amid this stock market rally.
Adding to the pressure, the U.S. Supreme Court has cleared the way for the government to sell off $4.4 billion worth of Bitcoin previously seized from the Silk Road marketplace. This decision came after the Supreme Court declined to hear an appeal related to the ownership of 69,370 BTC. The ruling upholds a previous decision by a California court, which ordered the liquidation of these assets.
The case, initiated by Battle Born Investments, claimed rights to the Bitcoin through a bankruptcy estate, arguing that the funds were stolen by an individual known as “Individual X.” However, the courts ruled in favor of the government, allowing the auction to proceed.
What Resistance Levels Is Bitcoin Currently Testing?
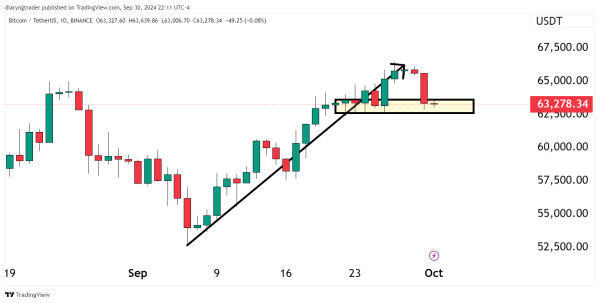
According to the BTC/USDT chart over the last four hours, the crypto has tested resistance between $63,894 and $64,500. Following this attempt, Bitcoin faced a correction of 3%; this even could extend toward critical support levels at $60,900 and $59,149.

The Relative Strength Index (RSI) is currently around 55, indicating that Bitcoin is in a neutral zone without reaching overbought levels yet. This suggests that a short-term correction could push Bitcoin back into the resistance zone and allow the RSI to enter overbought territory. If a correction occurs this week, it may push Bitcoin’s price above $65,000.
Additionally, the Moving Average Convergence Divergence (MACD) indicator is below the signal line, signaling a bearish trend and decreased buying pressure. If Bitcoin fails to gain upward momentum and continues to slide, BTC may witness some stabilization around the support levels of the $61.5K to $60K zone.
If the price struggles to maintain these levels, a deeper correction could occur, leading Bitcoin to revisit support levels between $58,670 and $57,300, marking a significant decline of approx 8.23% from current prices.


