Analyst sets Bitcoin roadmap to $200,000 
![]() Cryptocurrency Jul 19, 2024 Share
Cryptocurrency Jul 19, 2024 Share
Bitcoin’s (BTC) newfound momentum above $60,000 could be part of the anchor driving the maiden cryptocurrency to a new all-time high valuation of $200,000, according to a trading expert.
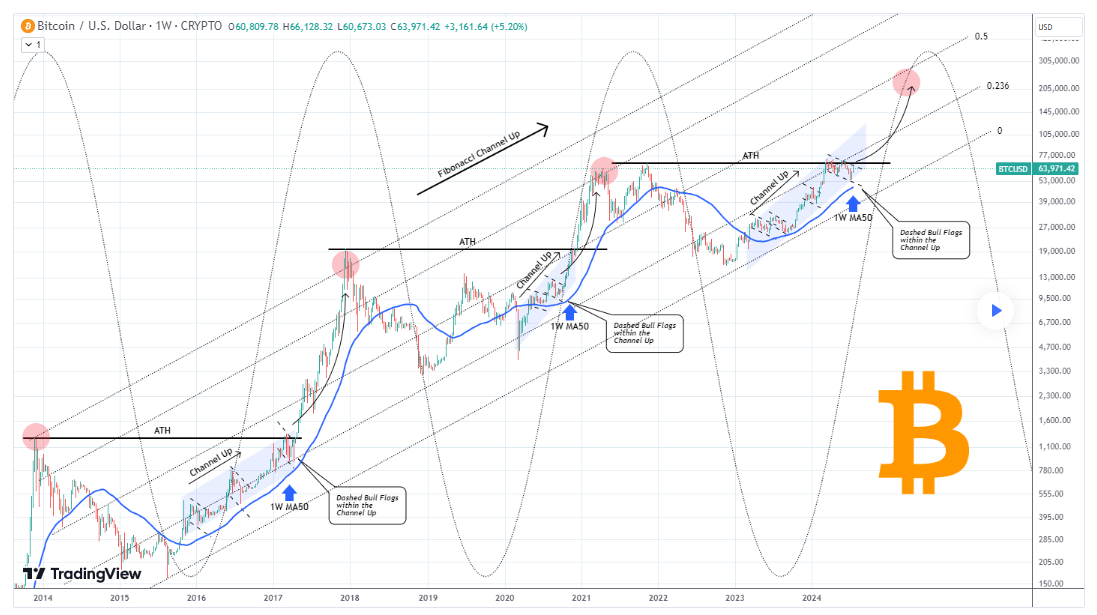
Particularly, an analysis shared by TradingShot in a TradingView post on July 19 focused on a sequence of technical patterns that historically indicate significant upward movements in Bitcoin’s price.
According to the analyst, Bitcoin is nearing the top of a four-month bull flag pattern. TradingShot pointed out that this pattern is part of a larger, long-term channel-up pattern.
Picks for you
Grayscale prepares for Bitcoin and Ethereum ETF spinoffs in July 35 mins ago Tornado Cash’s $1.9 billion resurgence indicates growing demand for privacy 38 mins ago How rich is South Dakota's senator: Mike Rounds' net worth revealed 3 hours ago Bitcoin analyst eyes $180,000 by 2025 based on BTC price historical patterns 4 hours ago
It remains a critical price movement because once Bitcoin breaks above the bull flag, it is expected to trigger a parabolic breakout, surpassing the all-time high trend line.
The analysis parallels the current bull flag and similar patterns observed in previous Bitcoin cycles. In these past cycles, breaking above the bull flag level initiated a parabolic rally, propelling Bitcoin to new heights.
 Bitcoin price analysis chart. Source: TradingView/TradingShot
These short-term channel-down patterns, essentially smaller declines within the giant gull flag, often cause short-term investors and traders to make hasty decisions, potentially missing out on significant gains.
The $200k target
TradingShot maintained that Bitcoin remains within its bull cycle despite recent market corrections. The analysis also incorporated Sine Waves to predict the timing of the cycle’s peak, suggesting that we may be 11-12 months away from reaching the top.
According to the expert, the previous cycle peak reached the 0.786 Fibonacci retracement level of the Fibonacci Channel Up. TradingShot anticipates that Bitcoin could get the 0.5 Fibonacci level this time, aligning with the Theory of Diminishing Returns. Despite this deceleration, the target price for Bitcoin is projected to be at least $200,000.
“The Sine Waves indicated that we may be another 11-12 months before the Cycle’s Top. Since the previous Cycle Top ‘only’ reached the 0.786 Fibonacci retracement level of the Fib Channel Up, we could expect this time to go as high as the 0.5 Fib (deceleration), possibly the Theory of Diminishing Returns kicking in. Still the Target may be at $200,000 at least,” teh expert said.
If Bitcoin follows this projected path, it could see unprecedented levels, offering substantial returns for investors who remain patient and strategic.
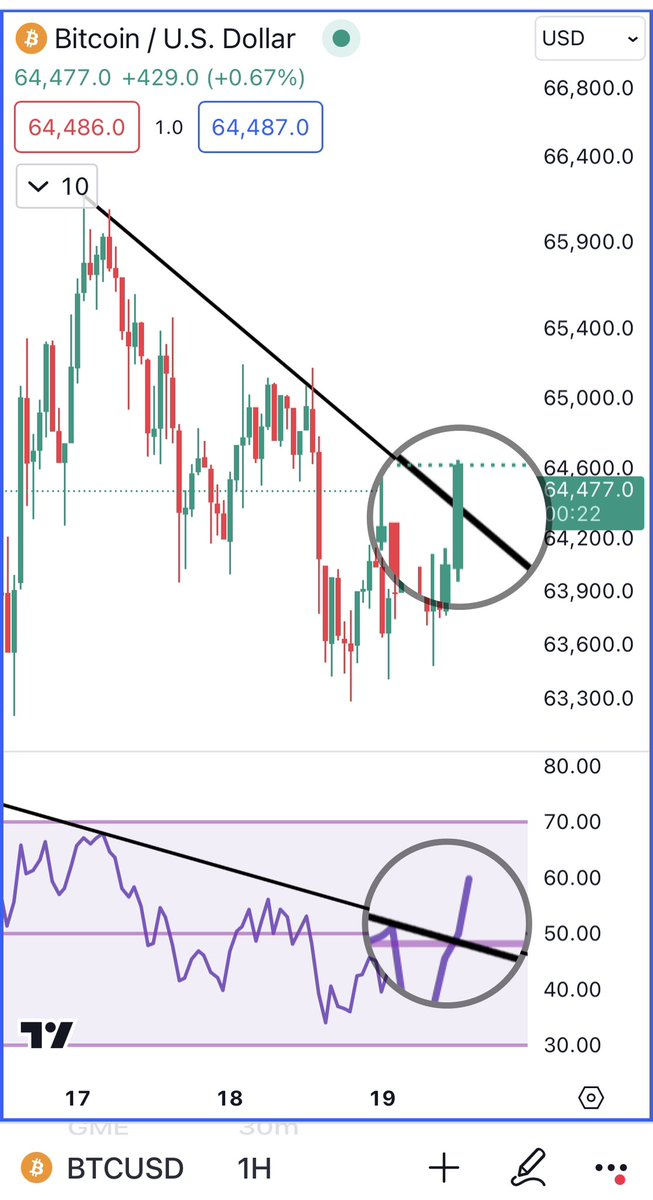
At the moment, Bitcoin aims to break past the $65,000 resistance, which is considered crucial for the asset to reclaim the $70,000 mark in search of a new high. Consequently, short-term indicators point to a possible sustained bullish run for Bitcoin.
In particular, views from crypto analyst Ali Martinez suggested that Bitcoin looks to break through multiple trendlines, with surpassing $65,000 as the next target.
 Bitcoin price analysis chart. Source: TradingView/Ali_Charts
Bitcoin price analysis
At the time of writing, Bitcoin was trading at $64,143, with modest daily losses above 1%. On the weekly chart, Bitcoin is up almost 11%, with a seven-day high of nearly $66,000.
 Bitcoin seven-day price chart. Source: Finbold
At the moment, Bitcoin’s support is around $58,000, with additional buying interest at $62,000. Resistance is notable at $66,000, with minor resistance around $64,500. Overall, these levels are crucial for traders’ entry and exit decisions.
Disclaimer: The content on this site should not be considered investment advice. Investing is speculative. When investing, your capital is at risk.

