Analyst sets Bitcoin path between $48K and $67K; What is next for BTC? 
![]() Cryptocurrency Jul 10, 2024 Share
Cryptocurrency Jul 10, 2024 Share
The Bitcoin (BTC) market has recently witnessed significant selling pressure, pushing prices down to $53,500 amid a large-scale sell-off by the German government and repayments by Mt. Gox’s creditors. However, after the sharp decline, Bitcoin has shown resilience, rebounding to $57,500.
In a July 9 post on X (formerly Twitter), trader Justin Bennett provided a detailed breakdown of Bitcoin’s current trends, supported by crucial technical indicators and price movements.
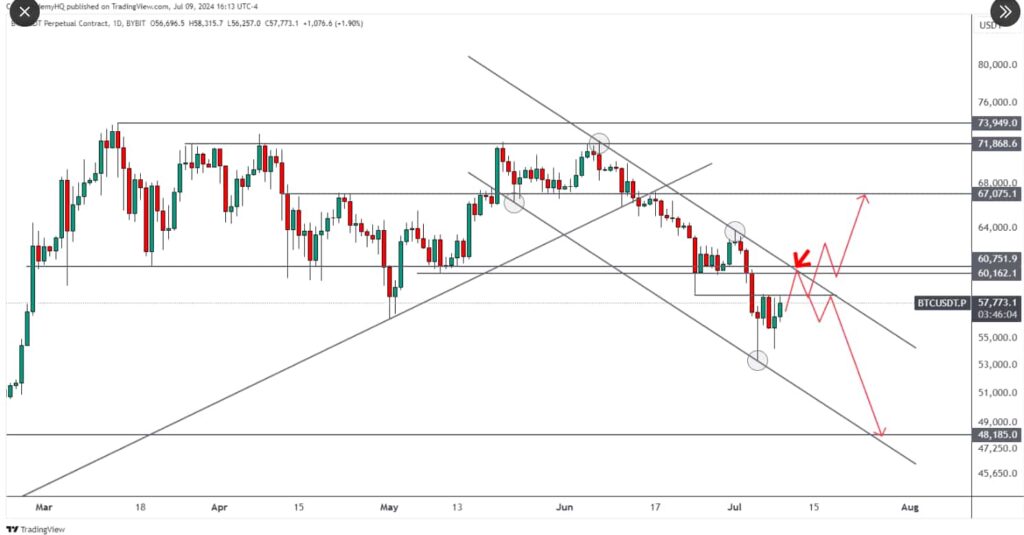
Bennett’s analysis of the BTC/USDT chart indicates a critical juncture for Bitcoin. After a sustained downward trend, Bitcoin has reached a support level near $57,773. The price is currently testing the resistance zone between $60,162 and $60,751. In his analysis, he outlined two scenarios – bearish rejection and bullish rebound.
Picks for you
Logan Paul's net worth 2024: How rich is Jake Paul’s older brother? 31 mins ago If you invested $1K in Bitcoin when Tesla first bought it, you'd be this much in profit 48 mins ago Bitcoin’s 4-year pattern ‘suddenly’ presents month for next price top 3 hours ago This is how much Andrew Tate getting released from Romania is worth 4 hours ago  Bitcoin price analysis chart. Source: Justin Bennett / X
If Bitcoin manages to reclaim and hold above the $58,400 level, a retest of the $60,000 to $60,700 range is highly probable. The price action within this range will be pivotal in determining the next significant move for BTC.
Should Bitcoin break and hold above the $60,700 resistance level, it is likely to continue its upward trajectory towards the $67,000 zone.
A successful retest and hold at $67,000 could further bolster bullish sentiment, potentially driving the price towards higher resistance levels at $71,868.6 and ultimately $73,949, indicating a bullish rebound.
Conversely, if Bitcoin fails to reclaim the $58,400 level or gets rejected at the $60,000 to $60,700 resistance range, a downward movement is likely.
A failure to break above $60,700 could lead to a bearish reversal, driving the price back down toward the $58,400 support level.
Breaking below $58,400 would likely accelerate the downward momentum, with the next significant support level around $48,185.
Upcoming economic indicators
Crypto market participants are eagerly awaiting the U.S. CPI data, which is expected to be released on Thursday, July 11. The overall financial market will closely track this crucial inflation data as it may set the stage for the Fed’s future stance on their policy rate plan.
Analysts at Citi (NYSE: C) have forecasted that the Federal Reserve could slash rates by 200 basis points over eight consecutive meetings from September through July 2025.
This rate cut scenario, extending to summer, would lower the benchmark to a range of 3.25% to 3.5%.
Lower interest rates are generally bullish for riskier assets like cryptocurrencies because they reduce the cost of borrowing and increase liquidity, encouraging investors to seek higher returns in alternative instruments like cryptocurrencies.
What’s next for BTC?
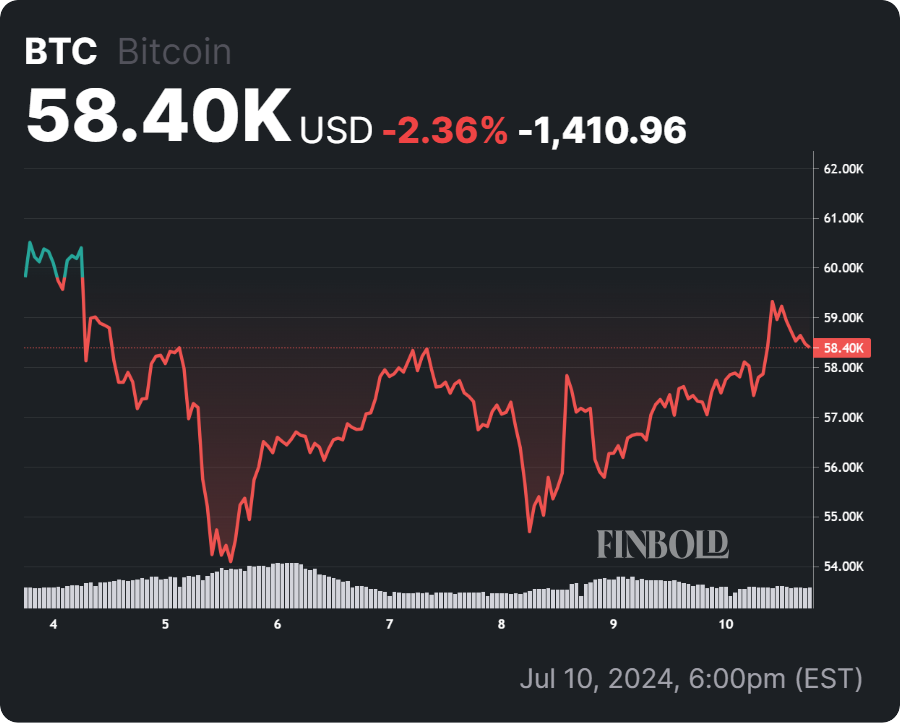
After dropping to around $54,400 in the last 24 hours, Bitcoin has recovered, trading at $58,396 by press time. However, the daily change reflects an increase of 2%, while weekly time frames indicate a bearish sentiment, having plunged by 3% and 16% on a monthly basis.
 Bitcoin 7-day price chart. Source: Finbold
The next move for Bitcoin hinges on its ability to reclaim and hold above the $58,400 level and the price action within the $60,000 to $60,700 range.
Traders should monitor these levels closely, alongside the upcoming U.S. CPI and PPI data, to gauge the market’s next direction.
A breakout above $60,700 could pave the way to $67,000 and higher, while a failure to hold above $58,400 could lead to a retest of the $48,185 support level.
Disclaimer: The content on this site should not be considered investment advice. Investing is speculative. When investing, your capital is at risk.
