An analyst known for longer timeframe crypto calls says that Bitcoin (BTC) and digital assets are in the midst of a “historic setup.”
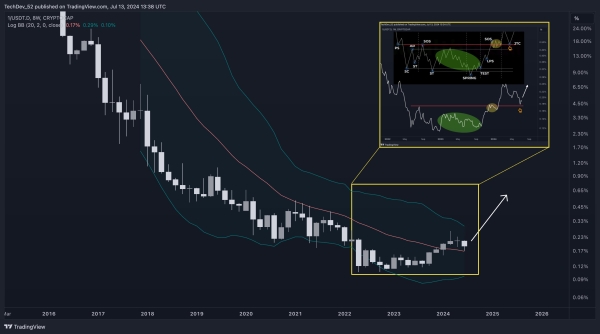
Pseudonymous analyst TechDev shares a chart with his 465,000 followers on the social media platform X showing the dominance of the crypto market cap against Tether’s USDT.
TechDev’s chart suggests that the crypto market cap is poised to gain more dominance at the expense of USDT after bouncing off a strong support level, implying that traders will convert their stablecoins into digital assets.
“Crypto dominance against USDT.
Of all the cyclical bull markets, this is the first-ever macro breakout and retest.
Historic setup.
The chart says previous runs may have been warmups.”
 Source: TechDev/X
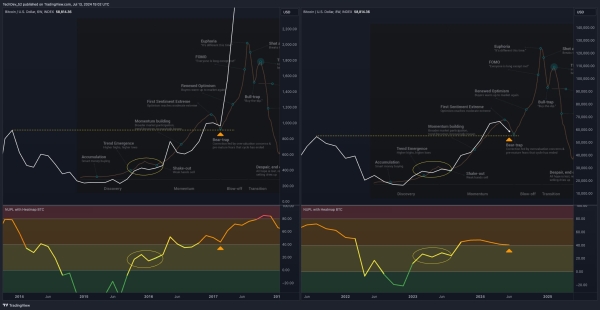
TechDev shares another chart showing what he thinks are the 16 different stages of the Bitcoin market cycle.
He believes that BTC is currently in the “bear trap” phase where a “correction fed by overvaluation concerns and pre-mature fears that the cycle has ended” brings prices down.
But according to the analyst’s chart, Bitcoin will soon enter the “Renewed Optimism” stage where “buyers warm up to the market again.”
 Source: TechDev/X
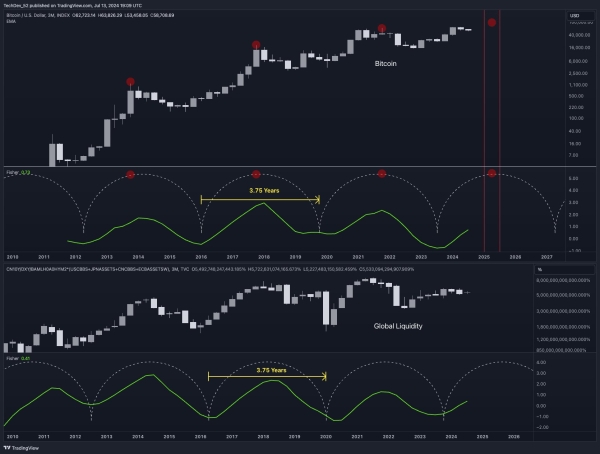
Just as Bitcoin is about to enter a new market cycle phase, TechDev highlights that global liquidity is the main driver of BTC prices.
He shares another chart comparing BTC to his global liquidity metric, lined up with the Fisher Transform indicator, which aims to pinpoint trend reversals.
The chart appears to suggest that the macro turning points for Bitcoin and global liquidity have historically happened every 3.75 years.
“Global Liquidity <– –> Bitcoin.
3.75 Years. Next Tweet at all-time high.”
 Source: TechDev/X
At time of writing, Bitcoin is trading at $63,024, up 4.74% in the past day.
Generated Image: DALLE-3
