AI sets XRP’s price for September 30 
![]() Cryptocurrency Sep 2, 2024 Share
Cryptocurrency Sep 2, 2024 Share
The price of XRP continues to face uncertainty, with the token consolidating below the $0.60 resistance level.
Although the trading broadly aligns with the overall market sentiment, investors had anticipated that recent developments in the Ripple and Securities and Exchange Commission (SEC) case would trigger a rally.
In the short term, XRP is experiencing increased selling pressure, coinciding with Ripple’s release of one billion XRP tokens through its escrow process. The transaction occurred in three phases, with 500 million, 200 million, and 300 million XRP tokens released on September 1.
Picks for you
Buy alert: Dogecoin technical analysis reveals imminent DOGE rally 3 mins ago 2 Bitcoin price catalysts that will make breaking $100,000 'a minimum expectation' 4 mins ago Brian Kemp’s net worth revealed: How rich is the Governor of Georgia? 14 mins ago Kristi Noem’s net worth revealed: How rich is the Governor of South Dakota? 44 mins ago
Indeed, the current selling pressure is emerging as legal uncertainty lingers over the SEC’s potential appeal of the recent court ruling. In the decision, the court ordered the blockchain company to pay a $125 million civil penalty, reducing the likelihood of XRP being declared a security.
Amid the possibility of an appeal, the outlook is uncertain, especially if the SEC would have to pay $125 million and statutory interest to Ripple if the appeal fails.
On the odds of an #SECvsRipple appeal, can any securities lawyers answer this question for me:
If there is an appeal and if @ripple wins on every issue over the SEC, aside from returning the $125M penalty to Ripple, does the SEC have to pay statutory interest on that?
— Fred Rispoli (@freddyriz) August 26, 2024
AI predicts XRP price
Given these fundamentals, Finbold turned to artificial intelligence (AI), algorithms, and the cryptocurrency forecasting platform PricePredictions to assess how XRP might trade in the coming weeks.
According to data retrieved on September 2, the platform projects bearish sentiment for the token, predicting it will likely trade at $0.463, reflecting a 16% drop from the current price at the time of publication.
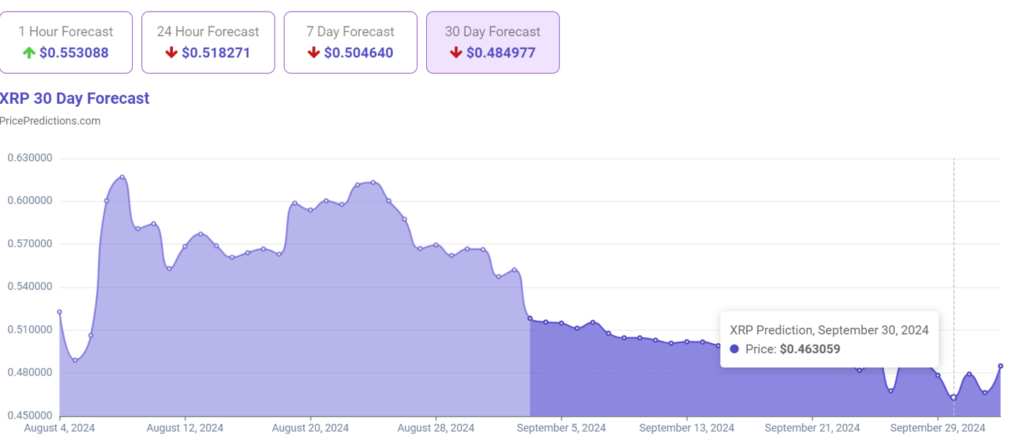 XRP price prediction for September 30. Source: PricePredictions
Notably, the prediction is based on technical analysis (TA) indicators like Bollinger Bands (BB), Moving Average Convergence Divergence (MACD), and average true range (ATR).
Despite the AI platform’s bearish outlook, cryptocurrency analyst Egrag Crypto suggested in an X post on September 2 that XRP will likely experience a significant rally based on historical price movements.
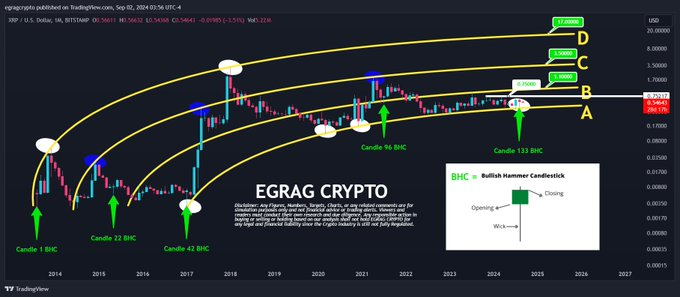 XRP price analysis chart. Source: TradingView/ Egrag Crypto
The expert highlighted the significance of the bullish hammer candlestick (BHC) formations in XRP’s price history. Notably, the first candle led to a staggering price increase of 750%, while the next resulted in a 40% rise. A particularly notable bullish hammer candle formation triggered an astronomical 43,000% gain, and another saw an 80% surge.
With the fifth bullish hammer candle forming, the potential gains remain unknown, but the pattern suggests a promising future. Based on this element, the expert indicated that investors should anticipate the “Bent Fork” high at $17, representing a potential 2,400% increase from the current market price. An even more optimistic target of $27 would imply an extraordinary 5,000% gain.
XRP price analysis
As of press time, XRP was trading at $0.55, having dropped by 1.4% in the last 24 hours. On the weekly chart, the token has plunged almost 8%.
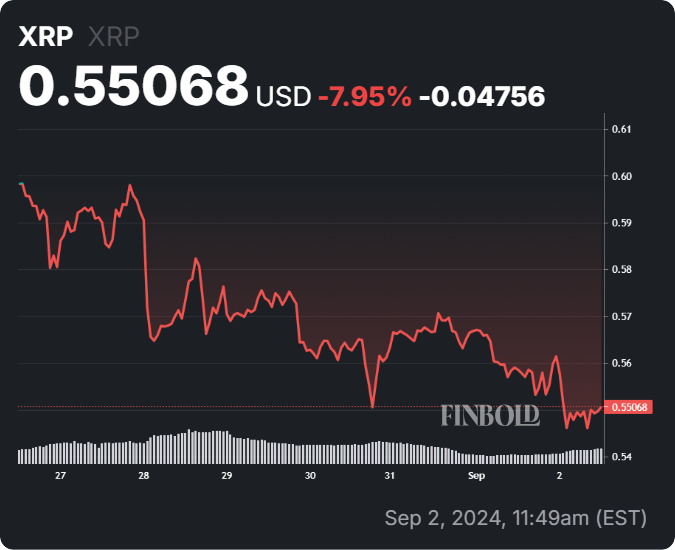 XRP seven-day price chart. Source: Finbold
Based on XRP’s current price movement, the 50-day simple moving average (SMA) stands at $0.5778, while the 200-day SMA is at $0.5466. This positioning, where the 50-day SMA is above the 200-day SMA, generally indicates a bullish trend in the medium term.
However, the fact that XRP’s current price is below the 50-day SMA but above the 200-day SMA suggests a period of consolidation with no clear directional momentum.
On the other hand, the 14-day Relative Strength Index (RSI) is at 42.96, which is below the neutral level of 50. This slightly bearish reading reflects modest downward momentum but is not extreme enough to signal an oversold condition.
The RSI remains comfortably away from the oversold and overbought thresholds, implying a lack of strong market conviction in either direction.
Disclaimer: The content on this site should not be considered investment advice. Investing is speculative. When investing, your capital is at risk.
